DATA STUDY · UPDATED 2026-10-29
The best and worst $1,000 bets of the last 10 years
Of 505 stocks, ETFs and cryptocurrencies we track with a full 10-year history, $1,000 put into NVIDIA in 2016-10 would be worth $122,388.14 at 2026-10. The same $1,000 in Skydance would be worth $173.50.
Past performance, not investment advice. This is a look back at history, not a recommendation to buy or sell anything.
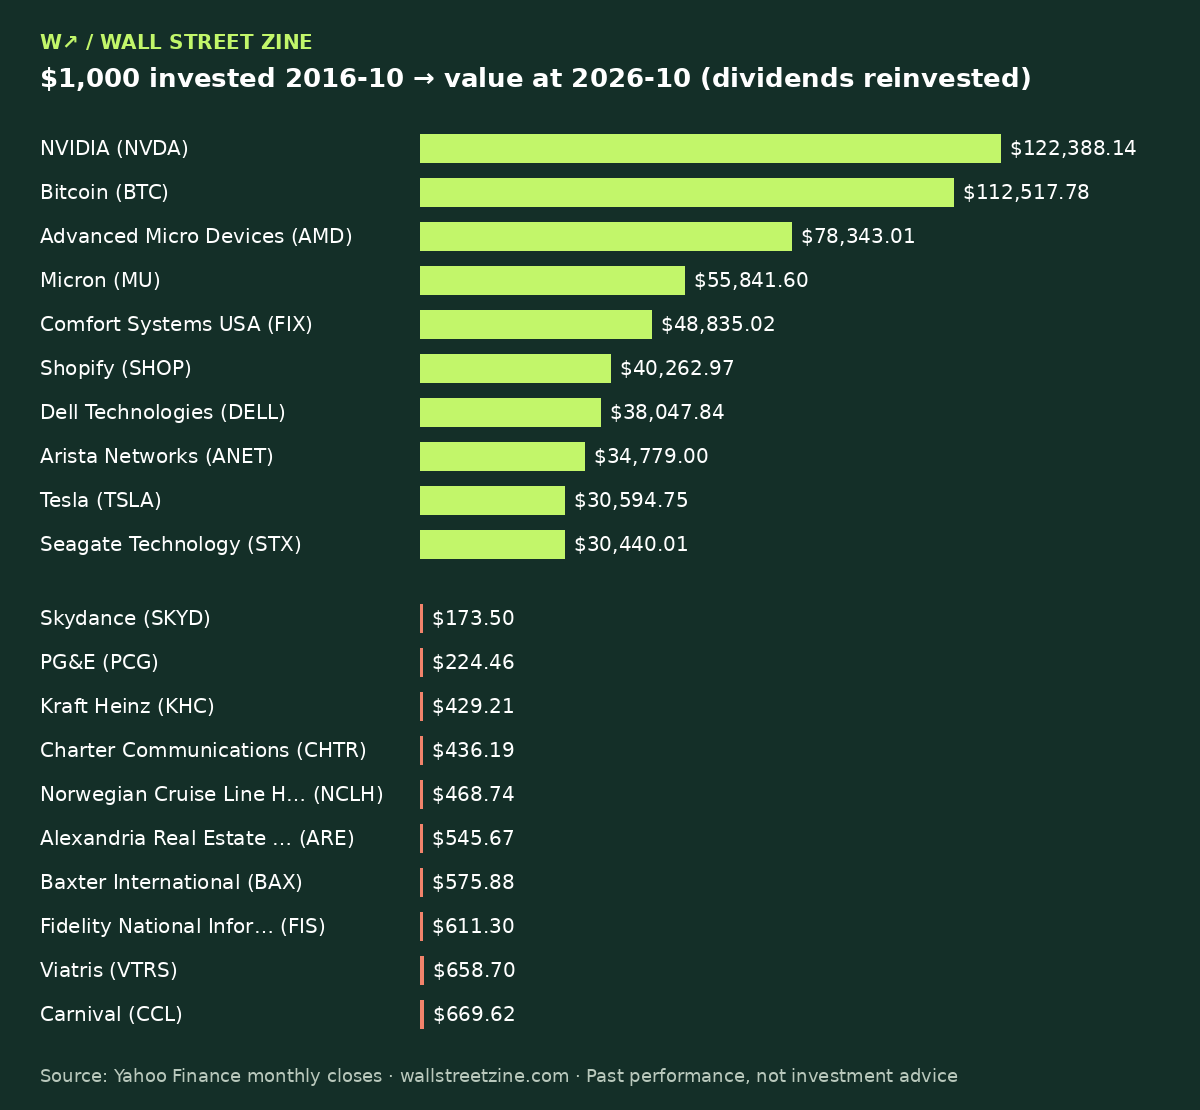
The 10 best
| Rank | Asset | Type | $1,000 became | Total return |
|---|---|---|---|---|
| 1 | NVIDIA (NVDA) | STOCK | $122,388.14 | 12,138.8% |
| 2 | Bitcoin (BTC) | CRYPTO | $112,517.78 | 11,151.8% |
| 3 | Advanced Micro Devices (AMD) | STOCK | $78,343.01 | 7,734.3% |
| 4 | Micron (MU) | STOCK | $55,841.60 | 5,484.2% |
| 5 | Comfort Systems USA (FIX) | STOCK | $48,835.02 | 4,783.5% |
| 6 | Shopify (SHOP) | STOCK | $40,262.97 | 3,926.3% |
| 7 | Dell Technologies (DELL) | STOCK | $38,047.84 | 3,704.8% |
| 8 | Arista Networks (ANET) | STOCK | $34,779.00 | 3,377.9% |
| 9 | Tesla (TSLA) | STOCK | $30,594.75 | 2,959.5% |
| 10 | Seagate Technology (STX) | STOCK | $30,440.01 | 2,944.0% |
The 10 worst
| Rank | Asset | Type | $1,000 became | Total return |
|---|---|---|---|---|
| 505 | Skydance (SKYD) | STOCK | $173.50 | -82.6% |
| 504 | PG&E (PCG) | STOCK | $224.46 | -77.6% |
| 503 | Kraft Heinz (KHC) | STOCK | $429.21 | -57.1% |
| 502 | Charter Communications (CHTR) | STOCK | $436.19 | -56.4% |
| 501 | Norwegian Cruise Line Holdings (NCLH) | STOCK | $468.74 | -53.1% |
| 500 | Alexandria Real Estate Equities (ARE) | STOCK | $545.67 | -45.4% |
| 499 | Baxter International (BAX) | STOCK | $575.88 | -42.4% |
| 498 | Fidelity National Information Services (FIS) | STOCK | $611.30 | -38.9% |
| 497 | Viatris (VTRS) | STOCK | $658.70 | -34.1% |
| 496 | Carnival (CCL) | STOCK | $669.62 | -33.0% |
Methodology
Universe: the 505 assets on Wall Street Zine with monthly data covering 2016-10 to 2026-10 (assets with shorter histories are excluded). $1,000 lump sum at the 2016-10 monthly close, valued at the 2026-10 close. Stocks and ETFs use Yahoo Finance adjusted closes (dividends reinvested, splits adjusted); crypto uses closing prices. Fees, taxes, inflation and FX are excluded. Survivorship bias applies: delisted companies are not in our list, so the real worst outcomes were worse. Full details on the methodology page. Data as of 2026-10-29.
Free to cite with a link to this page. Full ranking: all 505 assets over 10 years.